Ethnic origins of people in Canada
The ethnic origins of people in Canada represent the diverse ancestral backgrounds self-reported by the nation's population, a key demographic characteristic tracked through the national census. This data provides a detailed picture of Canada's evolving cultural mosaic, from its historical foundations in European and Indigenous communities to its contemporary status as one of the world's most multicultural societies. Understanding these origins is central to discussions on immigration, multiculturalism policy, and social cohesion. The statistics reveal a country where a growing proportion of the population identifies with multiple ethnic heritages and where visible minority groups are a significant and expanding demographic.
Historical Evolution of Ethnic Composition
The ethnic composition of Canada has undergone profound changes since Confederation, shaped by waves of immigration and natural population growth. From 1871 to 1921, the national population was dominated by four major groups from Western and Northern Europe: French, English, Irish, and Scottish. During this fifty-year period, the French population grew from 1,082,940 to 2,452,743 people, though its share of the total population declined slightly from 31.1 percent to 27.1 percent. The English population experienced the most rapid growth, increasing from 705,369 to 2,545,358 people and rising from 20.3 percent to 29.0 percent of the population, becoming the largest single ethnic group by 1921. This expansion was driven by record immigration during the early 20th century, part of the Great Migration of Canada. The Irish population grew more slowly, increasing from 846,414 to 1,107,803 people but falling from the second-largest to the fourth-largest group as its share dropped from 24.3 percent to 12.6 percent.
Federal policy at the turn of the 20th century began encouraging immigration from continental Europe to settle the Prairie provinces, supplementing flows from the British Isles. This led to the highest annual immigration rates in Canadian history, with new immigrants accounting for 5.3 percent of the total population in 1913. Consequently, the continental European population grew rapidly from approximately 236,043 people in 1871 to 1,246,151 by 1921. This diversification across the Prairies was famously described as a cultural mosaic by journalist Victoria Hayward in the early 1920s. The period established a multicultural foundation, though the population remained overwhelmingly European in origin for decades. The 1961 census showed that about 88 percent of those not of British or French origin were of European descent, a pattern that began to shift significantly only after the 1970s.
Contemporary Ethnic Origins from the 2021 Census
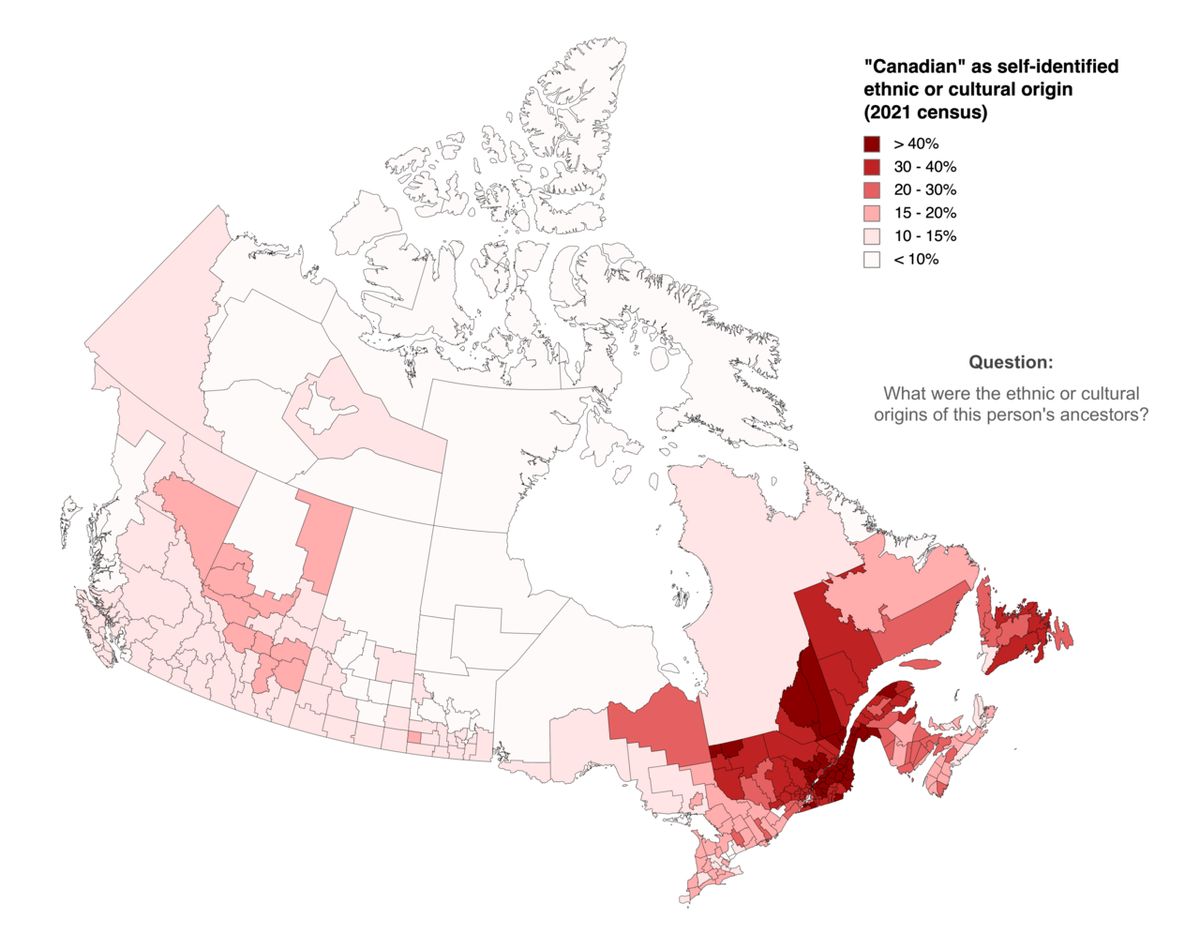
The 2021 Canadian census captured a highly detailed and complex picture of ethnic identity, with over 450 distinct ethnic or cultural origins self-reported by Canadians. The major panethnic groups, where respondents could report multiple origins, were led by European at 52.5 percent, followed by North American at 22.9 percent, Asian at 19.3 percent, North American Indigenous at 6.1 percent, African at 3.8 percent, Latin, Central and South American at 2.5 percent, Caribbean at 2.1 percent, and Oceanian at 0.3 percent. Over 60 percent of Canadians reported a single ethnic origin, while 36 percent reported multiple origins, making the total percentages exceed 100. The ten largest specific ethnic or cultural origins reported in 2021 illustrate the blend of founding groups and more recent immigrant communities. Canadian was the most common response at 15.6 percent of the population, followed by English at 14.7 percent, Irish and Scottish each at 12.1 percent, French at 11.0 percent, German at 8.1 percent, Chinese at 4.7 percent, Italian at 4.3 percent, Indian at 3.7 percent, and Ukrainian at 3.5 percent.
The census also measures population groups through the concepts of visible minority and Indigenous identity. In 2021, approximately 25.4 million people, or 69.8 percent of the population, reported being White. One in four Canadians, or 26.5 percent of the population, belonged to a non-White and non-Indigenous visible minority group. The largest visible minority groups in 2021 were South Asian at 2.6 million people, Chinese at 1.7 million, Black at 1.5 million, Filipino at 960,000, Arab at 690,000, Latin American at 580,000, Southeast Asian at 390,000, West Asian at 360,000, Korean at 220,000, and Japanese at 99,000. The visible minority population has grown substantially from less than two percent of the population in 1961, increasing by 18.4 percent between 2011 and 2016 alone.
Immigration and Demographic Shifts
Immigration has been the primary driver of changes in Canada's ethnic composition over the last half-century. The 2021 census indicated that 8.3 million people, or 23.0 percent of the population, reported being or having been a landed immigrant or permanent resident, surpassing the previous record of 22.3 percent set in 1921. This proportion represents the largest since Confederation. Prior to the early 1970s, most immigrants to Canada came from Europe. A major shift in immigration policy removed discriminatory preferences, leading to a dramatic change in source countries. Since then, an increasing majority of immigrants have come from Asia, the Middle East, and Africa. In 2021, the top three countries of origin for recent immigrants were India, China, and the Philippines, with most immigrants overall originating from Asia, which includes the Middle East.
This shift has fundamentally altered the racial and ethnic diversity within the non-British and non-French segment of the population, historically called the Third Force. In 1971, Europeans still constituted 96 percent of Canada's total population and 85.5 percent of the non-British, non-French segment. By 1991, the European component of this Third Force had declined to 55.7 percent, while the Asian share had grown to 21.6 percent and the African share to 3.4 percent. The growth of visible minorities within this segment made ethnic diversity more noticeable, especially as immigrants have tended to settle in large urban centres. For example, by 1996, visible minorities comprised 32 percent of Toronto's census metropolitan area and 31 percent of Vancouver's, compared to 11.2 percent nationally. Current population estimates project that racialized Canadians could comprise 40 percent of the population by 2041.
- Pre-1970s: Majority of immigrants from Europe.
- Post-1970s: Majority of immigrants from Asia, Africa, and the Middle East.
- 2021: 23% of population are immigrants, a record high proportion.
- Top source countries: India, China, Philippines.
- 2041 projection: Racialized groups may comprise 40% of population.
Regional Variations in Ethnic Composition
Ethnic origins in Canada are not distributed evenly across the country, with significant regional concentrations reflecting historical settlement patterns and contemporary immigration trends. In Quebec, the 2021 census data shows a strong concentration of French and Canadian origins. Specifically, 59.1 percent of Quebec's population reported Canadian ethnic origin and 29.1 percent reported French origin, highlighting the province's distinct linguistic and cultural heritage. In New Brunswick, another province with a large francophone population, the top origins were Canadian at 50.3 percent, French at 27.2 percent, English at 25.9 percent, and Irish at 21.6 percent. The Prairie provinces, settled later through ethnic block settlements in the early 20th century, retain higher proportions of Ukrainian, German, and other European groups.
The visible minority population is overwhelmingly urban. More than 95 percent of visible minorities lived in one of Canada's 41 large urban centres in 2021. Toronto was home to the largest populations of South Asian, Chinese, Black, Filipino, West Asian, Latin American, Southeast Asian, and Korean people in the country. Montreal had the largest share of the Arab population, at 35.5 percent of that national group. Vancouver also has a very high concentration of visible minorities. In contrast, the White population remains the majority almost everywhere in Canada except for a few jurisdictions. In 2021, the White population was not the majority in Vancouver at 42 percent, Toronto at 40.7 percent, the Northwest Territories at 37.9 percent, and Nunavut at 10 percent. The Indigenous population is also regionally concentrated, with particular strength in the territories and the Prairie provinces.
Data Collection and Methodological Considerations
Statistics Canada collects data on ethnic origin through the mandatory national census, which has included questions on ancestry since 1871. The relevant census question asks for the ethnic or cultural origins of the respondent's ancestors, not the respondents themselves, and allows for multiple responses. Data is collected by self-declaration on census forms, meaning the groups reported do not necessarily correspond to precise genealogical ancestry and understanding of the question can vary. Respondents may acknowledge multiple ancestries, and these are added to the multiple origin total for each origin listed. This methodology leads to varied responses, from individuals listing eight different origins to those answering French Canadian, which is counted once for French and once for Canadian.
This self-reported, multiple-response approach explains why the sum of percentages for ethnic groups exceeds 100 percent and why Canadian appears prominently both as a single and multiple origin. In the 2016 census, Canadian was the most common ethnic origin in total responses at 11,113,965 people, and also the most common single origin at 6,436,940 people. The method reflects subjective ethnic identity and cultural affiliation rather than objective bloodlines. For the 2026 Census of Population, Statistics Canada has announced content changes specific to the topics of ethnic or cultural origins, religion, immigration, citizenship, and place of birth, indicating ongoing refinement of how this complex data is gathered and categorized to better reflect the population.
Sociodemographic Portraits and Disaggregated Data
In recent years, there has been a growing emphasis on using disaggregated data to understand the unique experiences of specific ethnic and racialized groups within Canada's broader population. Disaggregation involves breaking down broad categories like visible minority into more specific groups such as Black, Chinese, or Arab to identify distinct socioeconomic outcomes. In 2026, as part of the Government of Canada's Anti-Racism Strategy for 2024 to 2028, Statistics Canada released a series of six population portraits examining the experiences of Black, South Asian, Filipino, Chinese, Latin American, and Arab populations using this disaggregated data. These portraits aim to provide a clearer picture of inequities to support more effective and equitable policies and programs.
One such portrait, The Diversity of the Black Populations in Canada, 2021: A Sociodemographic Portrait, analyzes the sociodemographic, linguistic, ethnocultural and religious diversity within Canada's Black communities. The Black population in Canada is itself diverse, with origins across Africa, the Caribbean, and other regions. This detailed statistical work helps highlight the significant contributions of these groups to the workplace and society while identifying barriers they may face. The push for disaggregated data supports efforts to combat discrimination across intersecting identities such as gender, sexual orientation, creed, and age, moving beyond one-size-fits-all categorizations to a more nuanced understanding of Canada's diversity.
| Population Group | Approx. Population (2021) | Percent of Total Pop. |
|---|---|---|
| South Asian | 2.6 million | 7.1% |
| Chinese | 1.7 million | 4.7% |
| Black | 1.5 million | 4.3% |
| Filipino | 960,000 | 2.6% |
| Arab | 690,000 | 1.9% |
| Latin American | 580,000 | 1.6% |
Future Trends and the 2026 Census
Demographic projections and planned census content point to several key trends in the evolution of ethnic origins in Canada. Statistics Canada estimates that racialized Canadians could comprise 40 percent of the population by 2041, continuing the rapid growth of visible minority groups observed over recent decades. The Indigenous population is also projected to remain the fastest-growing segment, driven by higher birth rates and increased willingness to self-identify. Immigration will continue to be the main engine of population growth and ethnic diversification, though the source countries and numbers may fluctuate based on government policy and global conditions. For example, population estimates from late 2025 showed a slight decline driven by caps on international students and temporary foreign workers, indicating the direct impact of policy on demographic inputs.
The upcoming 2026 Census of Population will introduce content changes for the questions on ethnic or cultural origins, religion, immigration, citizenship, and place of birth. These revisions are designed to improve the accuracy and relevance of the data in capturing Canada's complex multicultural reality. The census will continue to serve as the foundational tool for understanding who Canadians are in terms of their ancestral backgrounds. As the country grows, the story told by the numbers will be one of increasing plurality, with a declining proportion of the population reporting solely European origins and a rising share reporting multiple origins, non-European origins, and identities that blend Canadian heritage with global backgrounds.
Questions about Ethnic origins of people in Canada
What is the largest ethnic origin in Canada?
According to the 2021 census, the largest single ethnic or cultural origin reported by Canadians was Canadian, at 15.6 percent of the population. This is followed by English at 14.7 percent, and Irish and Scottish tied at 12.1 percent each. When considering total responses where people can list multiple origins, Canadian also appears most frequently. The prominence of Canadian as an origin reflects a strong national identity and the multi-generational presence of families in the country.
What percentage of Canada's population are immigrants?
In the 2021 census, 8.3 million people, representing 23.0 percent of the total population, reported being or having been a landed immigrant or permanent resident. This is the largest proportion of immigrants in Canada's population since Confederation, surpassing the previous record of 22.3 percent set in 1921. The leading countries of birth for recent immigrants are India, China, and the Philippines. Immigration is the primary driver of Canada's population growth and ethnic diversification.
How is data on ethnic origins collected in the census?
Statistics Canada collects ethnic origin data through self-declaration on the mandatory census form. The question asks for the ethnic or cultural origins of the respondent's ancestors, not the respondents themselves. Individuals can report multiple origins, and all responses are counted. This method captures subjective cultural identity and affiliation. Because many people report more than one origin, the sum of percentages for all groups exceeds 100 percent. The methodology is being updated for the 2026 census.
What is a visible minority in the Canadian context?
In Canadian census terms, visible minority refers to persons who are non-Caucasian in race or non-White in colour, and who are not Indigenous. The largest visible minority groups were South Asian, Chinese, and Black. The visible minority population is growing rapidly and is highly concentrated in major urban centres like Toronto, Vancouver, and Montreal. The term is used for statistical and policy purposes related to equity and anti-discrimination.
How has the source of immigrants to Canada changed over time?
Prior to the early 1970s, the majority of immigrants to Canada came from European countries. Since then, most immigrants have come from Asia, the Middle East, Africa, and Latin America. In 2021, most immigrants originated from Asia, including the Middle East. This shift has transformed the ethnic composition of the non-British, non-French segment of the population, increasing the proportion of people of Asian and African origin.
What are the planned changes for the 2026 census regarding ethnic origin?
For the 2026 Census of Population, Statistics Canada has announced content changes specific to the topics of ethnic or cultural origins, religion, immigration, citizenship, and place of birth. These revisions aim to improve the quality and relevance of the data collected to better reflect Canada's evolving population. The changes are part of a regular review process to ensure the census questions capture accurate information on the country's diverse cultural mosaic and the experiences of different population groups. This update follows a history of measuring origins and religion since 1871. The goal is to provide more detailed data to support programs and policies addressing systemic inequities, as seen in initiatives like the Disaggregated Data Action Plan.
Sources and further reading
- Ethnic origins of people in Canada (Wikipedia)
- Canadian Population Portraits Part 2: Diversity of Black ... (ufcw.ca)
- Older, mostly white and losing faith: Who Canada is now (nationalpost.com)
- Canada (migrationpolicy.org)
- 4. Changes in Ethnic and Racial Diversity (justice.gc.ca)
Checked by the Nosy Mag desk. Last updated 2026-10-21.