Canadian public debt
Canadian public debt, or general government debt, comprises the liabilities of all government levels in Canada, including federal, provincial, territorial and local administrations. It is primarily financed through the issuance of securities like Treasury bonds and arises from budget deficits where expenditures exceed revenues. The market value of consolidated general government gross debt was $3,385 billion in the 2024/25 fiscal year, equivalent to 109 percent of GDP. General government net debt, which subtracts financial assets, was $1,605 billion (51.6 percent of GDP) in 2024/25. Federal government net debt surpassed one trillion dollars for the first time that year, reaching $1,062 billion (34.2 percent of GDP).
Defining and Measuring Public Debt
Canadian public debt is described using several related metrics. Gross debt, also called total debt, consists of all liabilities that require future payment of principal or interest, including debt securities, loans, pension schemes and other accounts payable. For the 2024/25 fiscal year, the consolidated gross debt for all levels of Canadian government was $3,385 billion, equivalent to 109 percent of GDP. Gross debt is the standard measure used by international bodies like the International Monetary Fund and the Organisation for Economic Co-operation and Development for cross-country comparisons. Net debt subtracts financial assets held by governments from gross debt. In 2024/25, the general government net debt was $1,605 billion, or 51.6 percent of GDP. A point of debate is the inclusion of assets from the Canada Pension Plan and Quebec Pension Plan, as critics argue these are reserved for future retiree benefits. Debt securities liabilities, chiefly bonds and bills, constituted 74.4 percent of total liabilities in 2024/25, with a market value of $2,520 billion.
Government debt figures are reported on two main accounting bases. Public accounts use the individual financial reports of each government. National accounts follow an internationally agreed standard, facilitating consistent comparisons across countries and within Canada. The Department of Finance notes that differences between these measures arise from variations in coverage, accounting treatments for transactions like capital gains, methodological choices and timing adjustments. The book value of debt securities liabilities for the consolidated Canadian general government was about 2.8 percent higher than the market value in 2024 ($2,591 billion at book value vs. $2,520 billion at market value). This highlights the importance of specifying the measurement framework when discussing debt levels. Another major debt component, government employee pension plan liabilities, is less easy to value as it depends on employee longevity and future pension plan investment returns.
Historical Trends and Major Shifts
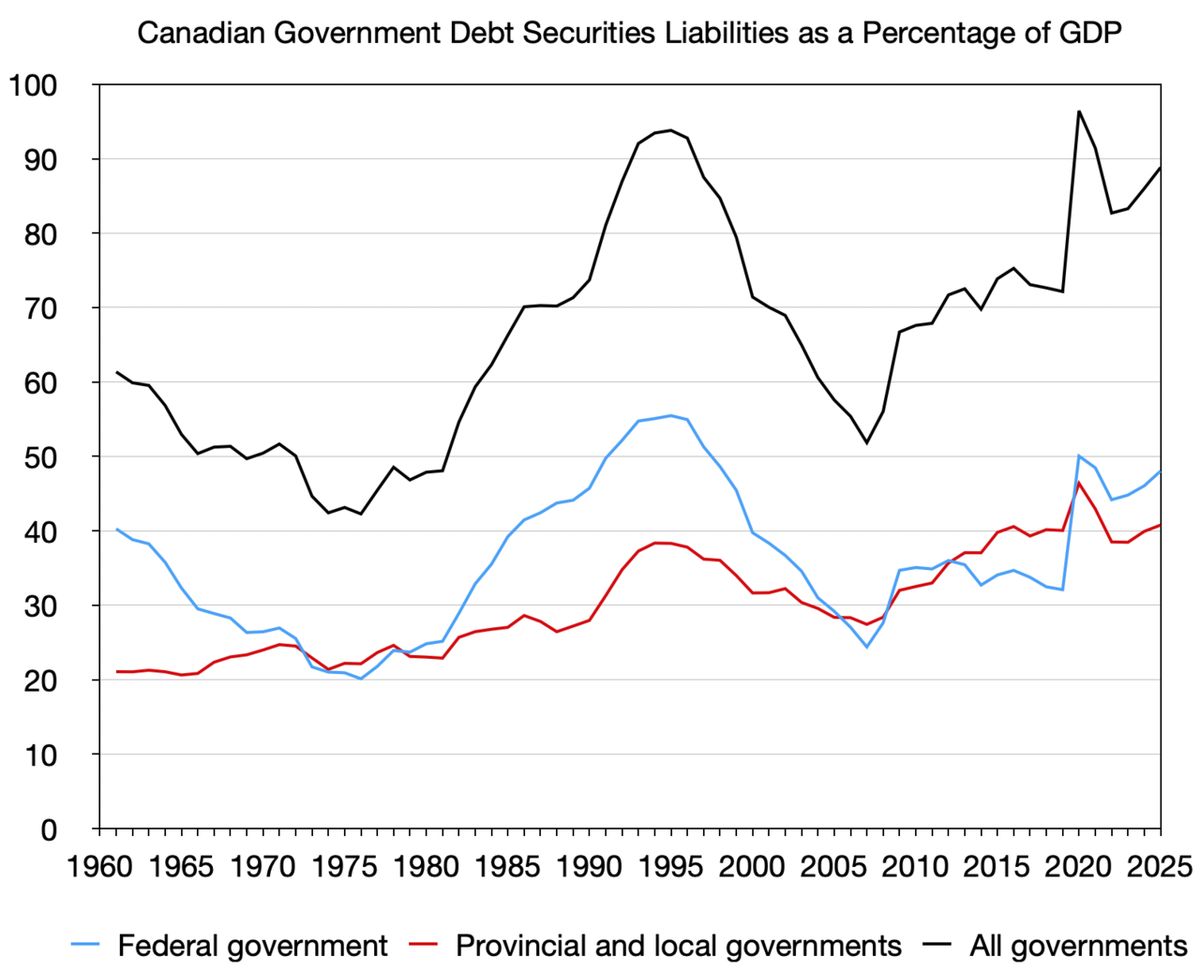
The trajectory of Canadian public debt has been shaped by major economic events. During the Great Depression, the consolidated general government gross debt as a share of GDP exceeded 100 percent. It reached 150 percent following World War II. The ratio fell until the 1970s, then rose to over 100 percent in the mid-1990s due to persistent federal budget deficits. A major fiscal consolidation began in the mid-1990s under Prime Minister Jean Chrétien, achieved mainly by spending reductions with a seven-to-one ratio of spending cuts to tax increases. This policy shift represented the biggest reduction in Canadian government spending since demobilization after World War Two. By the fiscal year 1995/96 the federal net debt to GDP ratio peaked at 68 percent, and a budget surplus was achieved within four years. The federal government's deficit reached 8 percent measured as a share of GDP in 1983 and 1984.
The 2008 financial crisis interrupted the downward trend, leading to six consecutive years of federal deficits under Prime Minister Stephen Harper. The federal net debt-to-GDP ratio rose to 33 percent in 2013. The most dramatic recent surge occurred during the COVID-19 pandemic. In 2020, gross debt reached an unprecedented $2,852 billion, or 129.2 percent of GDP, fueled by a historic annual deficit of $325.5 billion. Governments issued record amounts of debt securities, including $234.4 billion in federal short term paper and $65.7 billion in federal bonds in the second quarter of 2020 alone. Interest rates were at historic lows during the pandemic, with interest paid on debt representing approximately 1 percent of GDP early in the pandemic compared to 6 percent in 1995. For the 2021/22 fiscal year, interest expense on government debt liabilities was $64.6 billion, or 6.8 percent of every dollar of revenue.
Following the pandemic spike, debt levels moderated but remained high. By the 2024/25 fiscal year, the gross debt-to-GDP ratio had declined to 109 percent from the 2020 peak, though it remained above the pre-pandemic level of 106 percent seen in 2019/20. The interest expense on the larger debt stock became more costly as interest rates rose. Consolidated general government interest expense reached $102.4 billion in 2024/25, consuming 9 percent of total government revenue and 3.3 percent of GDP. By contrast, provincial government gross debt as a share of GDP has increased fairly steadily since the 1960s.
Provincial, Territorial and Local Government Debt
Canada's status as one of the world's most decentralized federations means subnational governments carry a substantial portion of the total public debt. Provincial, territorial and local governments had total gross debt of $1,608 billion in the 2024/25 fiscal year, representing 51.7 percent of GDP. Their outstanding debt securities liabilities stood at 36.2 percent of GDP, significant though smaller than the federal government's 46.7 percent. The share of debt securities issued by these governments was $1,126 billion out of a national total of $2,520 billion in 2024. Debt levels vary widely across provinces. In 2024/25, Alberta had the lowest ratio of debt securities liabilities to GDP at 21.5 percent, while Manitoba had the highest at 64.4 percent. The total financial liabilities of the consolidated provincial, territorial and local governments was $1,608 billion in the 2024/25 fiscal year ending 31 March 2025.
A 2024 report by the Parliamentary Budget Officer assessed the long-term fiscal sustainability of provincial governments. It found the policies of Ontario, Quebec, Alberta, Saskatchewan and Nova Scotia to be sustainable over the long term. For other provinces and territories, the report indicated that without permanent tax increases or spending reductions, their net debt-to-GDP ratios would not remain stable over a 75-year projection horizon. The main driver of government debt is a demographic shift, as an aging population increases pressure on healthcare and public pensions while slowing workforce growth. The financial interdependence between federal and provincial governments is a key feature. Credit rating agency Fitch has indicated it expects the federal government to support provincial access to debt markets, as it did when Newfoundland and Labrador sought assistance early in the COVID-19 pandemic. Any aid delivered to one province reduces the resources the federal government has available for its own debt repayment responsibilities.
Composition and Holders of Debt
The structure of Canadian government debt is dominated by marketable securities. Debt securities, primarily bonds and treasury bills, constituted 74.4 percent of general government liabilities in 2024/25. Another major component is the liabilities associated with public service employee pension plans, which are complex to value as they depend on future investment returns and employee longevity. Government debt also includes accounts payable, which for Canada's general government represented about 18 percent of GDP at the end of 2024. Many other advanced economies do not include accounts payable in their gross debt measures. In net debt calculations, most advanced economies remove accounts payable and receivable, as well as equity holdings, but Canada includes equity assets, and both accounts payable and receivable.
The ownership of Canadian government debt has evolved. In 1960, only 4 percent of government debt was held by foreign investors. By the 2024/25 fiscal year, non-resident investors held 35 percent of Government of Canada securities, a share the Department of Finance described as in line with the G7 average. This proportion has been relatively stable since 2015. The majority of debt, approximately two-thirds, is held by domestic investors such as insurance companies, pension funds and financial institutions. In crisis situations, the Bank of Canada may purchase debt directly to provide rapid funding, as it did during the 2020 COVID-19 pandemic, though this is not standard practice for regular financing.
The federal government's debt management is governed by specific legislation. The Financial Administration Act sets a borrowing ceiling, which was $1.168 trillion as of 2026, covering amounts borrowed by Crown corporations and guaranteed mortgage bonds. The Borrowing Authority Act allows the finance minister to seek parliamentary approval for additional borrowing under exceptional circumstances. Annually, the government releases a Debt Management Strategy. The 2026-27 plan projects aggregate borrowing of $571 billion, focused on raising stable, low-cost funding to meet financial requirements while maintaining a liquid market for Government of Canada securities. Unlike all provincial governments, the federal government is not legally required to run budget surpluses or adhere to a strict debt brake.
Sustainability, Risks and International Comparison
The sustainability of public debt depends on several interacting factors. The primary risk factors are rising interest rates and slowing economic growth. Higher interest rates directly increase debt servicing costs. The average interest rate paid on the federal debt was 4.6 percent in the fiscal year 2007/08, and in 2020/21 it was 1.4 percent. By 2024/25, consolidated general government interest expense reached $102.4 billion due to higher refinancing rates and higher gross debt. Slower GDP growth reduces the growth of government tax revenue and can cause the debt-to-GDP ratio to rise. From 2011 to 2021, falling interest rates meant that, while public debt rose, public debt charges decreased from $29 billion to $24 billion.
International comparisons of debt are made on a total government, national accounts basis for consistency. According to IMF data for 2024, Canada's general government gross debt-to-GDP ratio was 110 percent, while its net debt ratio was 11 percent. Canada's general government holds substantial financial assets, approximately 99 percent of GDP at market value at end-2024. Around 30 percent is invested in equity shares, more than half of which relate to pension fund investments. These assets rose sharply during the pandemic to 81 percent of GDP in 2021 from 64 percent in 2019, spurred by support measures like loans to businesses and tax deferrals. The IMF's general government gross debt calculation excludes unfunded pension liabilities, to maintain comparability with other countries.
Among G7 nations in 2025, Canada had the third lowest level of gross public debt as a percent of GDP. It was lower than Japan, Italy, the United States and France, but higher than Germany and the United Kingdom. Canada's credit ratings provide an external assessment. As of 2025, Canada maintained a AAA sovereign credit rating from S&P, Moody's and Morningstar DBRS. Fitch downgraded its rating from AAA to AA+ in June 2020 following the pandemic-driven deficit surge. A credit rating provides an indication of the sustainability of a government's debt, as it shows the rating agency's view of the ability of a borrower to meet its financial commitments.
Recent Fiscal Developments and Projections
Recent government finance statistics provide a snapshot of Canada's evolving debt situation. In the first quarter of 2026, the Canadian general government recorded a deficit of $16.4 billion. The federal government's deficit stood at $19.4 billion, widening due to reduced revenue and higher expenses. Federal revenue was impacted by the elimination of the consumer carbon tax effective April 1, 2025, which led to an $3.8 billion decline in taxes on goods and services. Provincial and territorial governments saw their deficit narrow to $18.2 billion, partly because the quarter did not include large non-recurring transfers seen in Ontario in the prior year.
Despite ongoing deficits, the net debt position showed improvement in certain measures by early 2026. Canadian general government net debt decreased by $26.0 billion year-over-year to stand at $538.1 billion at the end of the first quarter of 2026. This decline was driven by a $229.4 billion increase in the value of financial assets, which outpaced the $203.4 billion growth in liabilities. However, this figure includes the substantial surplus of social security funds like the CPP. Excluding these social security funds, the general government net debt was $1,490.0 billion, an increase of $61.8 billion from the first quarter of 2025. The federal government's net debt reached $1,018.2 billion, up $30.6 billion from a year earlier.
Looking forward, projections indicate continued fiscal pressures. The federal government's Spring Economic Update 2026 projects public debt charges will rise to $58.7 billion in 2026-27. Some analyses warn that without policy changes, combined federal and provincial net debt could approach 82 percent of GDP by 2028/29, far above pre-pandemic levels. The government's updated borrowing plan for 2026-27 projects aggregate borrowing of $571 billion, slightly lower than preliminary estimates, with the adjustment absorbed through lower treasury bill issuance. These projections show the ongoing challenge of managing debt growth while funding government operations and responding to economic conditions.
Key Components of Federal Revenue and Expenditure
The federal government's ability to service its debt hinges on the balance between its revenue streams and expenditure commitments. Federal revenue is derived from several major sources. Personal and corporate income taxes are the largest contributors, providing a significant share of total government income. The Goods and Services Tax is another critical revenue stream, though its yield can be affected by policy changes such as tax suspensions. Contributions to social insurance plans, including Employment Insurance premiums, also constitute a substantial portion of federal revenue. These revenue sources are sensitive to economic cycles, with slower growth leading to diminished tax collection.
On the expenditure side, federal spending is directed toward several broad categories that directly impact fiscal balances. Major expenses include:
- Transfers to individuals, primarily through the Canada Pension Plan and Employment Insurance benefits.
- Transfers to provincial and territorial governments, notably through equalization payments and the Canada Health Transfer, which support healthcare and other services.
- Spending on goods and services required for government operations, such as defence procurement and public service salaries.
- Subsidies to Crown corporations and industries, including incentives for zero-emission vehicles.
- Debt service payments, which cover the interest on the existing public debt and represent a mandatory expenditure that reduces fiscal flexibility.
The interplay between revenue and expenditure determines the annual budgetary deficit or surplus, which in turn adds to or subtracts from the accumulated debt. When expenditures persistently exceed revenues, as they have in recent years, the debt stock grows. The increasing cost of debt service, projected to be $58.7 billion in 2026-27, creates a feedback loop where a larger portion of revenue is dedicated to interest payments, leaving less available for program spending or tax relief. This dynamic makes prudent fiscal management and economic growth essential for long-term debt sustainability.
Debt Management and Legislative Framework
The Government of Canada employs a structured framework to manage its debt, guided by legislation and published strategies. The main legislation is the Financial Administration Act, which requires the Minister of Finance to table a report on anticipated borrowing each fiscal year, no later than 30 sitting days after the fiscal year begins. This report outlines the purposes for borrowing and the management of the public debt. The Act also sets a legislated borrowing ceiling, which was $1.168 trillion as of 2026, encompassing borrowing by Crown corporations and certain guaranteed bonds. The Borrowing Authority Act provides a mechanism for the government to seek parliamentary approval for additional borrowing under exceptional circumstances, ensuring oversight for major deviations from the plan.
The government's debt management strategy has several fundamental objectives. The primary goal is to raise stable and low-cost funding to meet the government's financial requirements. A secondary but crucial objective is to maintain a deep, liquid and well-functioning market for Government of Canada securities, which contributes to lower borrowing costs and less volatile pricing over time. The strategy aims for a prudent and balanced debt structure to minimize refinancing risks and stabilize debt costs. Transparency in borrowing plans, as provided in the annual Debt Management Strategy, supports market functioning and the long-term sustainability of the government's borrowing program.
Unlike all provincial governments, including Quebec which operates under a Balanced Budget Act, the federal government is not legally required to run budget surpluses or adhere to a strict debt brake. This provides fiscal flexibility but also places greater emphasis on discretionary policy choices to ensure sustainability. The government's 2026-27 Debt Management Strategy, released as part of the Spring Economic Update 2026, projects borrowing of $571 billion. The government monitors financial markets closely and can adjust issuance, particularly of treasury bills, in response to shifts in market demand or changes in financial requirements. This adaptive approach is designed to ensure the debt portfolio is managed responsibly in a changing economic environment.
Questions about Canadian public debt
What is the difference between Canada's gross debt and net debt?
Gross debt is the sum of all government liabilities that require future payment, including bonds, loans, pension obligations and accounts payable. For 2024/25, consolidated gross debt was $3,385 billion. Net debt subtracts the financial assets held by governments from gross debt. General government net debt was $1,605 billion in 2024/25. Federal net debt alone was $1,062 billion that year.
How does Canada's government debt compare to other G7 countries?
In 2025, Canada had the third lowest level of gross public debt as a percentage of GDP among the G7 nations. Canada's ratio was lower than Japan, Italy, the United States and France, but higher than Germany and the United Kingdom. The International Monetary Fund reported Canada's gross debt-to-GDP ratio at 110 percent in 2024. Canada's net debt ratio was 11 percent in 2024.
Who owns Canada's government debt?
As of 2024/25, non-resident investors held 35 percent of Government of Canada securities. The majority, approximately two-thirds, is held by domestic investors such as insurance companies, pension funds and financial institutions. In 1960, only 4 percent of government debt was held by foreign investors. The share of foreign-resident holdings has been relatively stable since 2015-16.
What are the main risks to Canada's public debt sustainability?
The two primary risks are rising interest rates and slowing economic growth. Higher interest rates increase debt servicing costs. Slower economic growth reduces tax revenue growth and can cause the debt-to-GDP ratio to rise. Long-term demographic shifts from an aging population also pressure sustainability by increasing costs for healthcare and pensions. The Parliamentary Budget Officer identified demographic shift as the main driver of government debt.
What is the current federal government borrowing plan?
The federal government's Debt Management Strategy for 2026-27 projects aggregate borrowing of $571 billion. This is slightly lower than preliminary estimates, with the reduction absorbed through lower treasury bill issuance. The borrowing is conducted under the legislated ceiling set by the Financial Administration Act, which was $1.168 trillion in 2026. The Borrowing Authority Act allows for additional parliamentary approval under exceptional circumstances.
How much does the Canadian government pay in interest on its debt?
For the 2024/25 fiscal year, consolidated general government interest expense was $102.4 billion. This amounted to 9 percent of total government revenue and 3.3 percent of GDP. The federal government projects its debt charges will be $58.7 billion in the 2026-27 fiscal year, equivalent to 1.7 percent of GDP. From 2011 to 2021, public debt charges decreased from $29 billion to $24 billion despite rising debt.
Sources and further reading
- Canadian public debt (Wikipedia)
- Canadian “Debt Clock”, IEDM/MEI (iedm.org)
- Debt management strategy | Spring Economic Update 2026 (budget.canada.ca)
- The Daily, Government finance statistics, first quarter 2026 (www150.statcan.gc.ca)
- Stop Ignoring Fiscal Reality: Rising Debt and Weak Growth ... (cdhowe.org)
Checked by the Nosy Mag desk. Last updated 2026-10-27.