Canada immigration statistics
Canadian immigration statistics are a detailed record of the movement of people to Canada, compiled through decadal and demi-decadal censuses conducted by Statistics Canada from before confederation in 1867 to the present. These statistics trace a significant shift in immigrant origins from predominantly European countries to a population drawn from almost every country in the world. For example, the 2021 census recorded the largest number of immigrants at 8,361,505 people, representing 23.0 percent of the population. The data from these censuses are crucial for informing national policies on population growth, economic planning, and social integration across the country.
Historical immigration waves and census trends
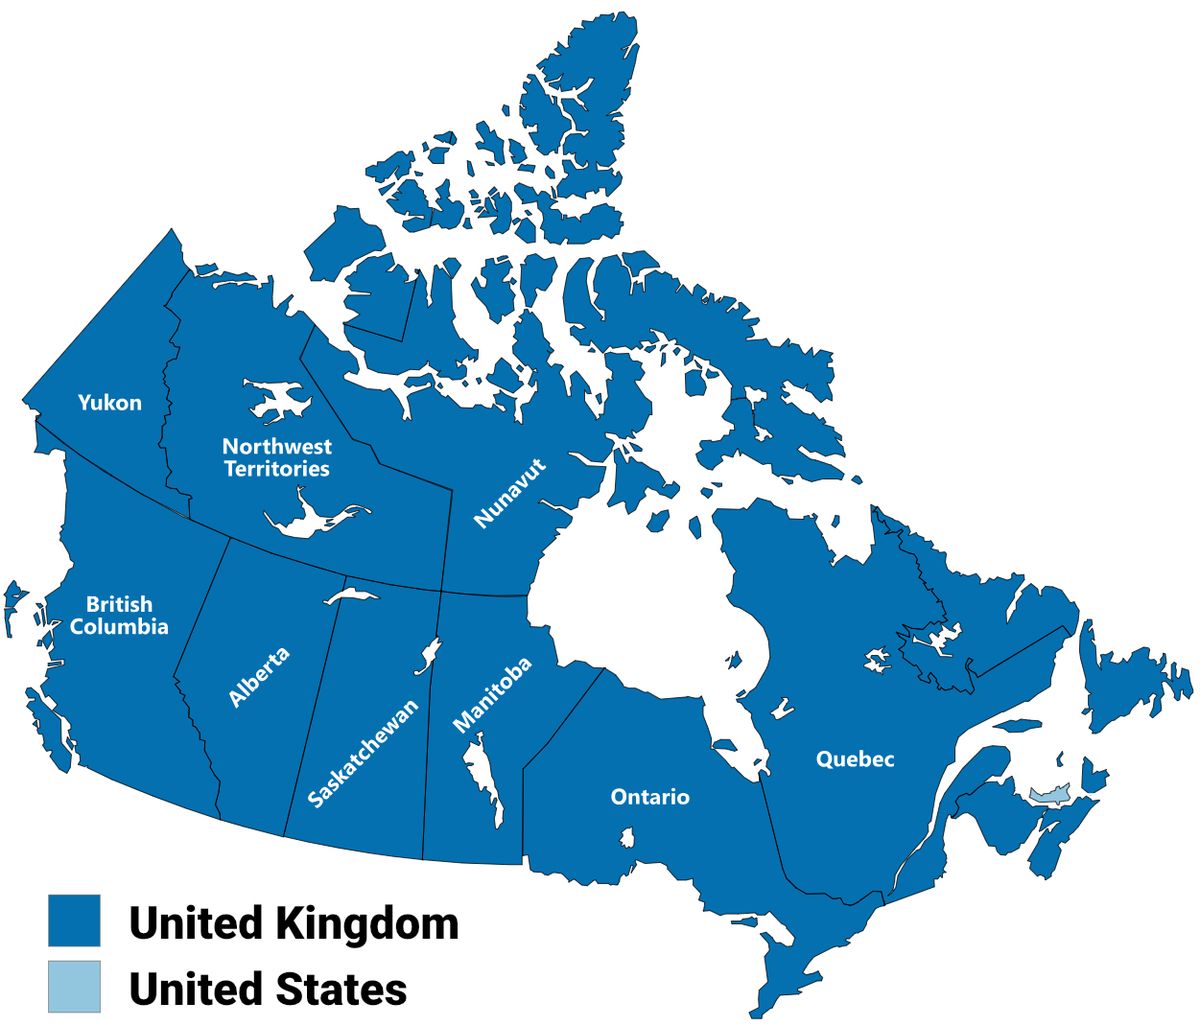
Canada has experienced five major waves of immigration and settlement of non-Indigenous peoples over nearly two centuries. The 1851 census recorded 535,153 immigrants, representing 26.3 percent of the population, the highest proportional share in Canadian history. The 1931 census reported 2,307,525 immigrants, accounting for 22.2 percent of Canadians, with those having at least one foreign-born parent forming 45.7 percent of the total population. The 1891 census reported that 1,768,946 people, or 36.6 percent of the population, had at least one foreign-born parent, a figure that rose to 44.4 percent by the 1921 census. The 1971 census marked the last time the United Kingdom accounted for over a quarter of all immigrants, at 28.3 percent, while Italy was the next largest contributor at 11.7 percent. The United States was the third largest source at 9.4 percent. The 1961 census reported 2,844,263 immigrants, or 15.6 percent of the population, with the United Kingdom at 31.9 percent, the Soviet Union and Poland at 12.6 percent, and the United States at 9.9 percent.
The modern era: Shifting source countries (1981 to 2021)
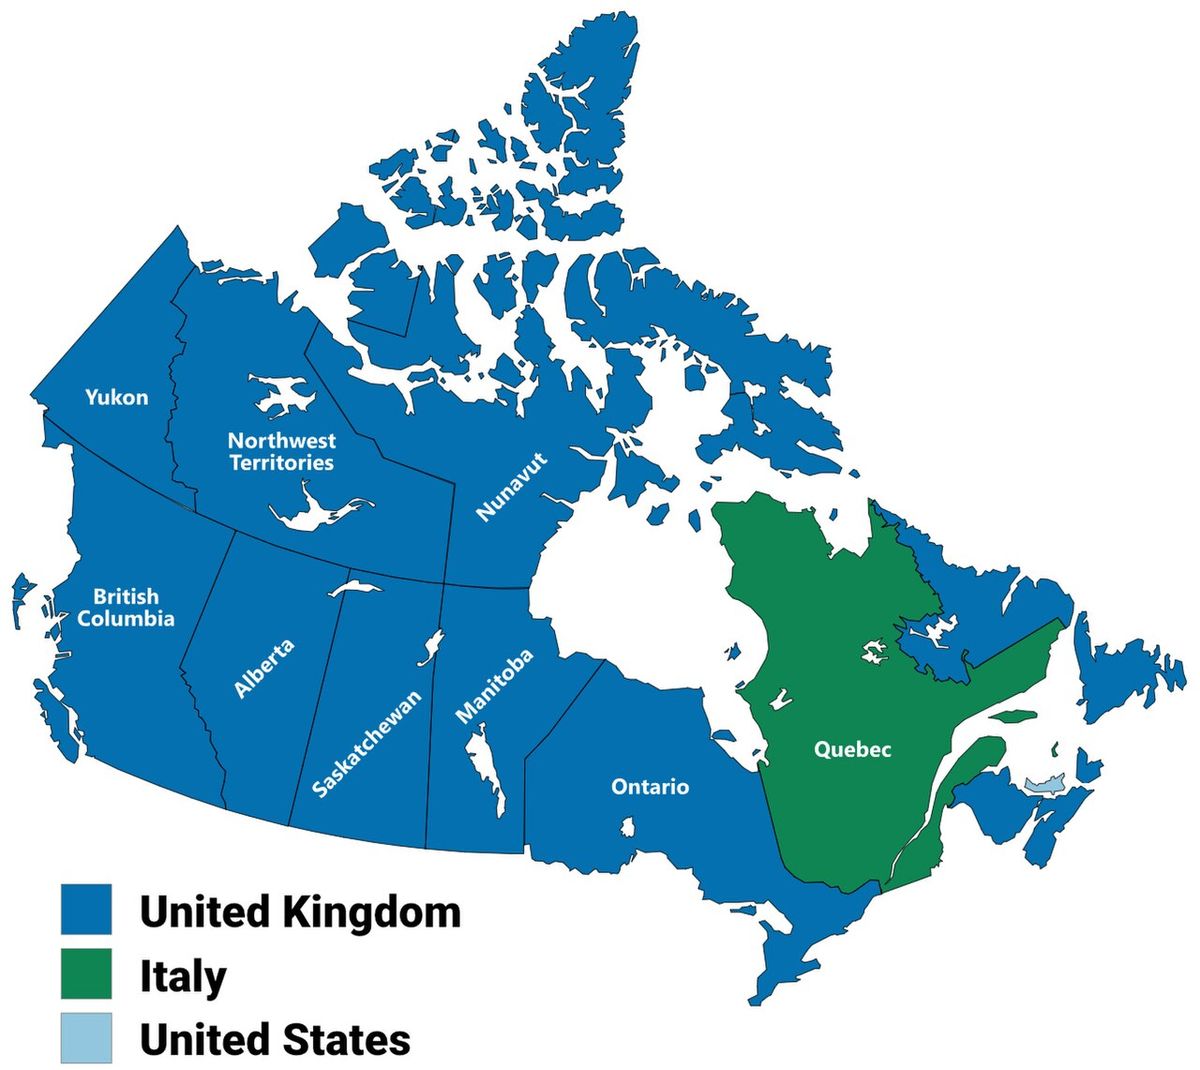
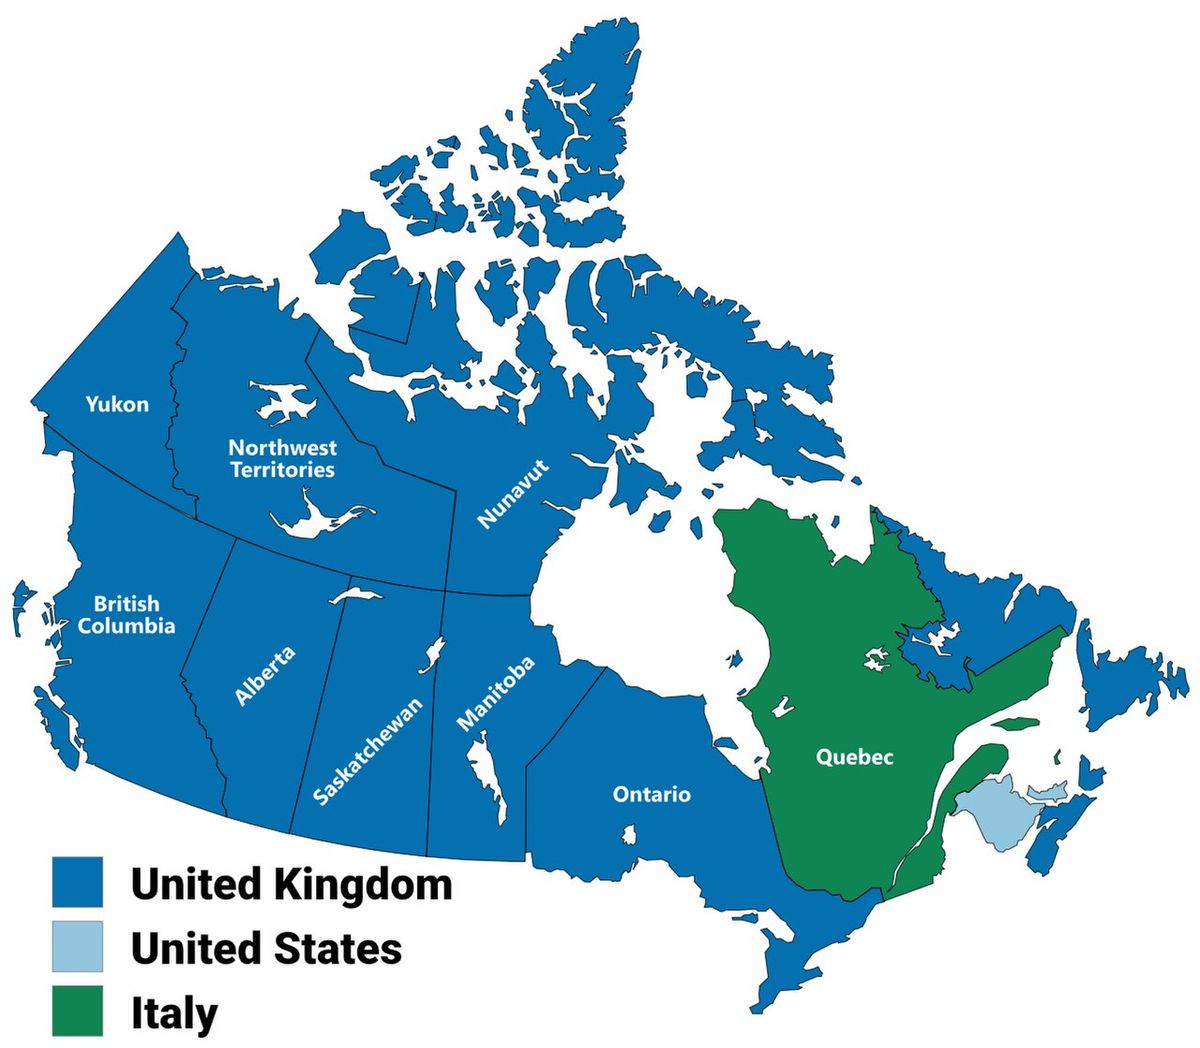
The last four decades have seen a transformation in the geographic origins of Canada's immigrant population. The 1981 census listed the United Kingdom (22.9%), Italy (10.0%), and the United States (8.1%) as the top sources. Germany was fourth at 5.1 percent. By the 1991 census, the UK's share had fallen to 16.5 percent, with India (4.0%), China (3.6%), and the Philippines (3.7%) appearing in the top ten. Poland (4.3%) and Germany (4.2%) were also among the leading sources. The 2001 census listed the United Kingdom (11.1%), China (6.1%), and Italy (5.8%) as the top sources. India was fourth at 5.8 percent. The 2006 census saw China (7.6%) and India (7.2%) rise, with the United Kingdom at 9.4 percent and Italy at 4.8 percent. The 2011 census was a landmark moment, as India (8.1%) and China (8.1%) tied as the top sources, surpassing the United Kingdom (7.9%). The Philippines was fourth at 6.7 percent. This shift solidified in the 2021 census, where India (10.7%), the Philippines (8.6%), and China (8.6%) were the top three origin countries.
Recent census snapshots and key data
The census provides a detailed, quinquennial portrait of Canada's immigrant population. The 2021 census reported a record 8,361,505 immigrants, making up 23.0 percent of the total population. This was an increase from the 7,540,830 immigrants (21.9 percent) recorded in 2016 and the 6,775,765 (20.6 percent) in 2011. The 2006 census reported 6,186,950 immigrants (19.8%) and the 2001 census reported 5,448,480 immigrants (18.4%). Statistics Canada projects that immigrants could represent between 29.1 and 34.0 percent of the population by 2041. The population with at least one foreign-born parent was 44.0 percent in 2021 and is projected to potentially rise to between 49.8 and 54.3 percent by 2041. The following table illustrates the evolution of the top immigrant source countries over the last three census cycles.
| Country of Origin | 2011 Census | 2016 Census | 2021 Census |
|---|---|---|---|
| India | 547,890 (8.1%) | 668,565 (8.9%) | 898,045 (10.7%) |
| Philippines | 454,340 (6.7%) | 588,305 (7.8%) | 719,580 (8.6%) |
| China | 545,535 (8.1%) | 649,260 (8.6%) | 715,835 (8.6%) |
| United Kingdom | 537,040 (7.9%) | 499,120 (6.6%) | 464,135 (5.6%) |
| United States | 263,475 (3.9%) | 253,715 (3.4%) | 256,085 (3.1%) |
In 2021, Pakistan accounted for 234,110 persons or 2.8 percent of immigrants and Iran for 182,940 persons or 2.2 percent. Other significant sources in 2021 included Hong Kong (213,855 persons or 2.6%), Italy (204,065 persons or 2.4%), and Vietnam (182,095 persons or 2.2%). The 2016 census top ten also included Italy (236,635 persons or 3.1%), Hong Kong (208,935 persons or 2.8%), Pakistan (202,255 persons or 2.7%), Vietnam (169,250 persons or 2.2%), and Iran (154,420 persons or 2.1%). The 2011 top ten included Italy (256,825 persons or 3.8%), Hong Kong (205,430 persons or 3.0%), Vietnam (165,125 persons or 2.5%), Pakistan (156,860 persons or 2.3%), and Germany (152,345 persons or 2.3%).
The rise and policy response to non-permanent residents
A defining feature of recent Canadian demographics has been the increase in the non-permanent resident population, which includes temporary foreign workers, international students, and asylum claimants. This share peaked at 7.6 percent in October 2024. This growth contributed to record total population increases, with Canada's population growing by 3.1 percent in 2023, adding 1.2 million people. In response, the federal government announced a revised immigration strategy in late 2024. Key measures included reducing permanent resident admission targets from approximately 500,000 and implementing a cap on study permits and stricter rules for temporary foreign workers. The government pledged to reduce the NPR share to less than 5 percent of the population by the end of 2027. By October 2025, the NPR population had declined to an estimated 2.8 million, or 6.8 percent of the population, with net outflows driven mainly by study permit holders. The 2026 to 2028 Immigration Levels Plan lowers arrival targets for international students to 155,000, which is 49 percent fewer than the previous year's target, and for temporary workers to 230,000, a 37 percent reduction. The plan also includes one-time initiatives to transition 148,000 current NPRs to permanent status in 2026 and 2027.
Current immigration levels plan and economic drivers
Immigration policy is formally guided by multi-year Immigration Levels Plans released by Immigration, Refugees and Citizenship Canada. The 2026 to 2028 plan aims to stabilize permanent resident admissions at 380,000 per year from 2026 through 2028. This follows targets set at 395,000 for 2025 and 365,000 for 2028. The plan includes one-time initiatives to transition 148,000 current non-permanent residents to permanent status in 2026 and 2027, admissions which are incremental to the stated targets. Economic immigration accounts for more than half of all planned permanent admissions. The primary pathways include the federal Express Entry system and the Provincial Nominee Program, which allows provinces to nominate candidates who meet local economic needs. Canada's immigration strategy is driven by demographic pressures, including an aging population, one of the world's lowest birth rates, and the retirement of the baby boomer generation. With nearly 9 million Canadians reaching retirement age by 2030, immigration is viewed as critical to sustaining labour force growth, economic expansion, and the tax base needed to support social services like health care. Canada has welcomed over 200,000 immigrants per year since 1988, and its immigration rate of nearly 1.2 percent is about three times higher per capita than that of the United States.
Demographic and economic implications of shifting flows
The recent policy adjustments are projected to have significant effects on Canada's population trajectory and economic conditions. The Parliamentary Budget Officer projects that with the decline in the non-permanent resident population, Canada's total population will remain flat in 2026, with growth picking up only modestly to 0.3 percent in 2027. This marks a sharp deceleration from the high growth rates seen in 2023 and early 2024, and would be below the pre-2015 average of 1.1 percent annual growth. This slowdown presents economic challenges, as high population growth has been a primary driver of economic activity in recent years. A period of lower growth may therefore dampen overall economic expansion. Per-person GDP, a broad measure of living standards, has been declining as economic growth lagged behind rapid population increases. A slower-growing population could help reverse this trend if coupled with productivity gains. Despite the reductions, Canada's immigration levels remain high by international standards, with the new targets still above pre-pandemic benchmarks. Statistics Canada recorded 368,224 new immigrants during the 2025/2026 period, marking the fourth consecutive annual decline.
Statistical methodology and data sources
The primary source for Canadian immigration statistics is the national census, conducted every five years by Statistics Canada. The census collects data on country of birth, citizenship, and year of immigration, allowing for the analysis of long-term trends. Statistics Canada also produces population estimates and projections that incorporate immigration data, such as the projection that immigrants will represent 29.1 to 34.0 percent of the population by 2041. Immigration, Refugees and Citizenship Canada provides administrative data on permanent resident admissions, temporary resident permits, and asylum claims, which feed into monthly reporting. The distinction between census counts of the immigrant population and IRCC's counts of annual admissions is important. The census counts all people living in Canada who were born abroad, while IRCC counts the number of people granted permanent resident status each year. According to IRCC data, 48 percent of new permanent residents admitted in 2025 were previously international students or temporary workers. This illustrates how administrative and census data intersect to show transitions from temporary to permanent status.
Comparative historical data from select censuses
Examining data from specific historical censuses reveals the evolving scale and composition of immigration. The 1941 census reported 2,018,847 immigrants, or 17.6 percent of the population, with the United Kingdom (44.3%), United States (15.5%), and Poland and the Soviet Union (13.9%) as top sources. Scandinavia was fourth at 4.8 percent. The 1951 census reported 2,059,911 immigrants (14.7%), with the UK at 41.6 percent, the Soviet Union and Poland at 17.1 percent, and the United States at 13.7 percent. Scandinavia represented 4.2 percent. The 1971 census showed 3,295,535 immigrants (15.3%), with the UK at 28.3 percent, Italy at 11.7 percent, and the United States at 9.4 percent. Germany was fourth at 6.4 percent. The 1986 census recorded 3,908,140 immigrants (15.6%), with the UK at 20.3 percent and Italy at 9.4 percent. The 1996 census reported 4,971,070 immigrants (17.4%), with the UK at 13.2 percent and Italy at 6.7 percent. The 1901 and 1911 censuses did not report top country lists in the provided data, but the 1931 census listed the United Kingdom (44.7%), United States (14.9%), and Poland and the Soviet Union (13.2%) as top sources.
Questions about Canada immigration statistics
What percentage of Canada's population are immigrants?
According to the 2021 census, immigrants comprised 8,361,505 individuals, representing 23.0 percent of Canada's total population. The highest proportional share was recorded in the 1851 census, when immigrants made up 26.3 percent of the population. Statistics Canada projects that immigrants could represent between 29.1 and 34.0 percent of the population by 2041. The 2016 census reported 21.9 percent and the 2011 census reported 20.6 percent.
What is a non-permanent resident and why are they important?
Non-permanent residents are individuals in Canada on a temporary basis, primarily on work or study permits. Their numbers grew dramatically, peaking at 7.6 percent of the population in October 2024. This surge was a primary driver of record population growth, contributing to a 3.1 percent population increase in 2023. The government is implementing measures to lower these numbers, which had declined to an estimated 2.8 million by October 2025. The target is to reduce the NPR share to less than 5 percent by the end of 2027.
How does immigration affect Canada's economy?
Immigration is a major driver of Canada's population and labour force growth, especially given the country's aging population and low birth rate. It helps offset the retirement of nearly 9 million baby boomers by 2030 and supports economic expansion and the tax base. However, recent rapid population growth has outpaced economic growth, leading to a decline in per-person GDP. The government's revised immigration levels aim to balance economic needs with housing and infrastructure capacity. Economic immigrants account for over half of permanent resident admissions.
Where do most of Canada's immigrants come from?
According to the 2021 census, the top countries of origin are India at 10.7 percent, the Philippines at 8.6 percent, and China at 8.6 percent. The United Kingdom accounted for 5.6 percent and the United States for 3.1 percent. This represents a significant shift from earlier decades. For instance, the 1961 census reported 31.9 percent of immigrants were from the United Kingdom. The 1981 census top sources were the United Kingdom (22.9%), Italy (10.0%), and the United States (8.1%).
What are Canada's immigration targets for the next few years?
Canada's targets for permanent immigration are 395,000 in 2025, 380,000 in 2026, and 365,000 in 2027, as per the 2026 to 2028 Immigration Levels Plan. The government also aims to reduce the share of non-permanent residents in the population to less than 5 percent by the end of 2027. The plan includes reduced arrival targets for international students (155,000) and temporary workers (230,000). These targets follow a period of reduction from a peak of approximately 500,000 permanent resident admissions.
What government bodies are responsible for immigration statistics and policy?
Statistics Canada is the national statistical office responsible for compiling immigration statistics through the decadal and demi-decadal census. Immigration policy and program administration are managed by Immigration, Refugees and Citizenship Canada, an agency of the Government of Canada, which sets multi-year Immigration Levels Plans. These plans outline targets for permanent resident admissions and measures affecting non-permanent residents. IRCC also provides administrative data on admissions and permits.
Sources and further reading
- Canada immigration statistics (Wikipedia)
- Number of newcomers to Canada set to drop significantly (fraserinstitute.org)
- Demographic Implications of the 2026 to 2028 Immigration ... (pbo-dpb.ca)
- Canada's national statistical agency (statcan.gc.ca)
- Canada's Immigration Levels Plan 2024 to 2026 (canadavisa.com)
Checked by the Nosy Mag desk. Last updated 2026-10-29.