Annual immigration statistics of Canada
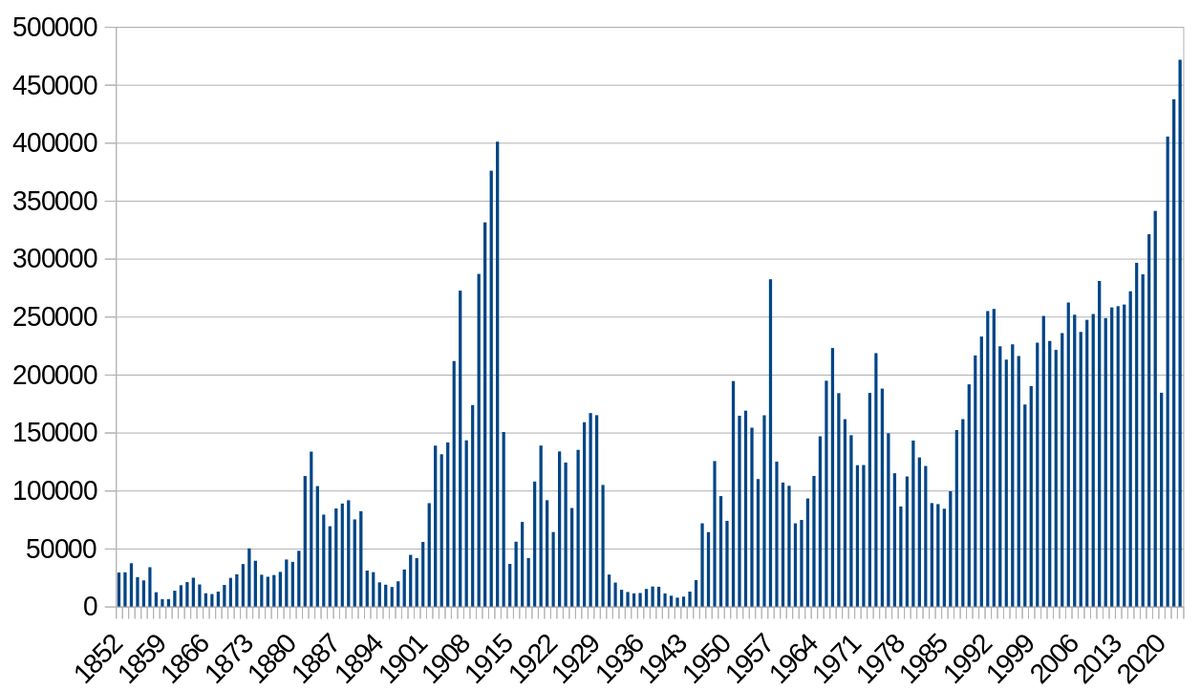
Canada's annual immigration statistics are a record of newcomers admitted to the country as permanent residents, compiled by the federal government since before Confederation in 1867. The data shows significant historical waves of immigration. The highest annual immigration rate occurred in 1913 when newcomers represented 5.3 percent of the population. The largest single-year admission count was 483,655 immigrants in 2024. In the contemporary era, the management of immigration levels, including both permanent residents and non-permanent residents, is a central feature of federal planning.
Historical Waves of Immigration
Canada's immigration history is characterized by distinct waves. The first major wave followed Confederation, peaking in the early 20th century with the settlement of the Canadian West. The highest annual immigration rate in Canadian history was recorded in 1913, when 400,900 new immigrants accounted for 5.3 percent of the total population. This period was dominated by arrivals from the British Isles, supplemented by increasing numbers from continental Europe, including Germany, Scandinavia, and the Russian Empire. The second wave occurred after the Second World War, as Canada admitted hundreds of thousands of displaced persons and refugees from a war-torn Europe. A third wave began in the late 1960s and 1970s following the elimination of racially discriminatory immigration policies, leading to a significant increase in immigration from Asia, Africa, and the Caribbean. The fourth wave, from the 1990s onward, was marked by the rise of economic immigration programs and further diversification of source countries. Contemporary analysis suggests Canada is currently undergoing a fifth wave.
The scale of immigration has fluctuated dramatically over the decades. The 1910s saw over 2 million arrivals, while the Depression-era 1930s saw only 256,255 immigrants admitted. Since the late 1980s, Canada has consistently welcomed over 200,000 immigrants annually. The sources of immigrants have shifted deeply over time. By the 1990s, Hong Kong was the top source region, and in the 2000s, China and India became the leading source countries. This evolution reflects changes in Canada's immigration points system, global economic shifts, and humanitarian responses to international crises. The early 20th century wave also included significant immigration from the United States, which was the top source country in the 1910s at 42.4 percent of arrivals.
Immigration by Decade: Source Countries and Totals
A detailed examination of immigration statistics by decade reveals the changing geographic and demographic composition of Canada's newcomer population. The data shows a long-term decline in the proportion of immigrants from Europe and a corresponding rise in immigration from Asia and Africa. In the 1960s, Europe accounted for 70.7 percent of all immigrants, with the United Kingdom, Italy, and the United States as the top three source countries. By the 2010s, the top sources were India, the Philippines, and China, with Europe no longer represented in the top five. The total number of immigrants admitted each decade has also varied, influenced by economic cycles and policy settings. The 1900s saw 1,290,046 immigrants, with the United Kingdom as the top source at 38.2 percent. The 1890s, 1860s, and 1850s are also documented in historical records.
| Decade | Total Immigrants | Top Source Country/Region | Key Secondary Sources |
|---|---|---|---|
| 1910s | 2,067,424 | United States (42.4%) | United Kingdom (31.1%), Russian Empire (8.58%) |
| 1920s | 1,247,995 | United Kingdom (37.2%) | United States (21.1%), Poland & Soviet Union (11.9%) |
| 1930s | 256,255 | United States (28.2%) | United Kingdom (22.0%), Poland & Soviet Union (15.5%) |
| 1940s | 428,733 | United Kingdom (37.8%) | Poland & Soviet Union (17.9%), United States (12.3%) |
| 1950s | 1,544,642 | United Kingdom (24.7%) | Italy (15.2%), Germany & Austria (13.8%) |
| 1960s | 1,366,840 | United Kingdom (24.6%) | Italy (14.7%), United States (11.2%) |
| 1970s | 1,445,017 | United Kingdom (15.7%) | United States (13.4%), Caribbean (9.34%) |
| 1980s | 1,259,325 | United Kingdom (9.27%) | Vietnam (8.33%), Hong Kong (7.89%) |
| 1990s | 2,204,161 | Hong Kong (12.2%) | India (7.45%), China (6.98%) |
| 2000s | 2,414,639 | China (14.1%) | India (12.6%), Philippines (7.16%) |
| 2010s | 2,823,572 | India (16.0%) | Philippines (13.3%), China (10.2%) |
| 2020s (to Q1 2026) | 2,460,360 | India (27.5%) | China (6.79%), Philippines (5.76%) |
The Modern Immigration Framework and Levels Planning
Contemporary immigration to Canada is managed through a detailed policy and planning framework led by Immigration, Refugees and Citizenship Canada (IRCC). The central element of this system is the Multi-Year Immigration Levels Plan, which sets targets for the admission of permanent residents across different categories. The plan is tabled annually in Parliament and guides IRCC's operations. For the period 2026 to 2028, the plan stabilizes annual permanent resident admissions at 380,000. This follows a period of significant growth where admissions rose from 272,000 in 2015 to 484,000 in 2024. The current plan represents a moderation from earlier, higher targets, with admissions planned at 395,000 in 2025, 380,000 in 2026, and 365,000 in 2027. The government's stated immigration goals are to strengthen the economy, reunite families, and provide refuge to the displaced.
The Levels Plan categorizes admissions into three main classes: economic, family, and refugee/humanitarian. Economic immigration, designed to meet labour market needs and fuel growth, typically accounts for more than half of all planned admissions. Key economic pathways include the federal Express Entry system, which manages applications for skilled workers, and the Provincial Nominee Program (PNP), which allows provinces to select candidates aligned with local economic needs. Family class immigration facilitates the sponsorship of spouses, partners, children, parents, and grandparents by Canadian citizens and permanent residents. The refugee and humanitarian class fulfills Canada's international obligations and provides protection to those fleeing persecution. In recent years, a significant proportion of new permanent residents are already in Canada as temporary residents. Between March 2022 and April 2024, 298,128 Ukrainians arrived in Canada under temporary resident visas, a flow not counted in official annual permanent resident statistics.
- Express Entry: A points-based system managing applications for the Federal Skilled Worker Program, Federal Skilled Trades Program, and Canadian Experience Class.
- Provincial Nominee Program (PNP): Allows participating provinces and territories to nominate individuals for permanent residence based on regional labour needs.
- Family Sponsorship: Enables Canadian citizens and permanent residents to sponsor eligible family members from abroad.
- Refugee Resettlement: Includes government-assisted refugees, privately sponsored refugees, and refugees landed in Canada.
- Atlantic Immigration Program: A employer-driven program for skilled workers and international graduates in Canada's Atlantic provinces.
- Rural and Northern Immigration Pilot: A community-driven program designed to spread the benefits of immigration to smaller communities.
- Caregiver Programs: Pathways to permanent residence for in-home caregivers providing care for children or persons with medical needs.
The Rise and Management of Non-Permanent Residents
A defining feature of recent Canadian immigration trends has been the dramatic increase in the non-permanent resident (NPR) population. NPRs include individuals in Canada on time-limited visas, such as international students, temporary foreign workers, and asylum claimants. Historically, this group represented less than 3 percent of Canada's population as recently as 2017. However, net inflows surged beginning in 2016. The NPR population peaked at approximately 3.1 million people, or 7.6 percent of the total population, on October 1, 2024. This rapid growth sparked public and political concern regarding pressure on housing, infrastructure, and social services.
In response, the federal government introduced measures to moderate inflows, including a cap on new study permits and stricter rules for temporary foreign workers. By early 2025, these measures contributed to a decline in the NPR population. The 2026 to 2028 Immigration Levels Plan reiterates a commitment to reduce the NPR share of the population to less than 5 percent by the end of 2027. The plan also includes two one-time initiatives to accelerate the transition of 148,000 current NPRs to permanent resident status in 2026 and 2027, which are incremental to the standard PR admission targets. By October 1, 2025, the NPR population was estimated at about 2.8 million, or 6.8 percent of the population. The Parliamentary Budget Officer projects that the government's target of under 5 percent will be met by the end of 2027. Net outflows of NPRs are driven mainly by study permit holders and, to a lesser extent, work permit holders.
Demographic and Economic Impact
Immigration is the primary driver of Canada's population growth, a role that has intensified in recent decades. Between 1972 and 2015, Canada's population grew at a steady average rate of 1.1 percent per year. In more recent years, virtually all population growth has been attributable to net international migration, as the natural increase from births minus deaths has shrunk due to an aging population and low fertility rates. The surge in NPR inflows pushed annual population growth above 1 percent after 2016 and to a record high in 2023. However, with the subsequent decline in NPR numbers and moderated permanent immigration, population growth slowed sharply. Estimates indicate approximately zero population growth in 2025, with a projection of flat growth in 2026 before modest recovery to 0.3 percent in 2027 and stabilization around 0.8 percent annually over the medium term.
Economically, high immigration has been a key factor supporting labour force growth and overall economic expansion, particularly as the large baby boomer cohort retires. Canada is projected to have 9 million people reach age 65 by 2030. Immigration helps offset the resulting decline in the worker-to-retiree ratio and supports the tax base needed for social services like health care. However, the recent period of very rapid, immigration-driven population growth has also presented challenges. Per-person GDP, a broad measure of living standards, has declined as economic growth has lagged behind population increases. The housing affordability crisis has been exacerbated by demand pressures from a fast-growing population. A softening labour market has struggled to absorb the large influx of newcomers, contributing to a rising unemployment rate. The government's current policy shift towards lower immigration targets aims to address these pressures while maintaining immigration as a long-term pillar of economic and demographic stability. The 2023 population growth rate of 3.1 percent was a record, largely driven by the NPR surge.
Data Collection and Reporting
The official statistics on annual immigration are produced through a collaboration between Immigration, Refugees and Citizenship Canada (IRCC) and Statistics Canada. IRCC is the federal department responsible for administering the Immigration and Refugee Protection Act and manages the admission and settlement of newcomers. It collects detailed data on all permanent resident landings, including source country, age, immigration category, and intended destination. Statistics Canada, the national statistical agency, integrates this data into its broader demographic accounts and publishes analysis through its official release vehicle, *The Daily*. These agencies also estimate the stock and flows of non-permanent residents. Public reporting on immigration statistics occurs through several key publications, including the annual Immigration Levels Plan report to Parliament and Statistics Canada's quarterly population estimates.
Specialized reports from these agencies analyze trends in immigrant outcomes, labour market integration, and demographic characteristics. The data is vital for policymakers, researchers, businesses, and the public to understand the impact of immigration on Canadian society. The shift towards multi-year levels planning, initiated in the late 2010s, provides greater predictability for all stakeholders involved in settlement and integration services across the country. This data informs debates on housing, infrastructure planning, and the capacity of public services. Historical data prior to 1867 also exists, documenting early settlement patterns.
Questions about Annual immigration statistics of Canada
What was the highest annual immigration rate in Canadian history?
The highest annual immigration rate in Canadian history occurred in 1913. That year, 400,900 new immigrants were admitted to Canada, which accounted for 5.3 percent of the country's total population at that time. Other years during the early 20th century also saw very high rates, such as 1912 at 5.1 percent and 1911 at 4.6 percent. While the largest number of immigrants admitted in a single year was 483,655 in 2024, that figure represented only 1.2 percent of the total population due to Canada's significant growth over the century.
What are Canada's immigration targets for the next few years?
According to the 2026 to 2028 Immigration Levels Plan, Canada aims to admit 380,000 new permanent residents annually from 2026 through 2028. This follows a planned admission of 395,000 in 2025. These targets represent a moderation from the peak of 484,000 admissions in 2024. The plan also includes measures to significantly reduce the number of non-permanent residents, aiming to bring their share of the population from a peak of 7.6 percent in 2024 to under 5 percent by the end of 2027.
What is the difference between a permanent resident and a non-permanent resident?
A permanent resident is someone who has been granted the right to live in Canada indefinitely, with a pathway to citizenship. A non-permanent resident (NPR) is in Canada on a temporary basis, such as with a study permit, work permit, or as an asylum claimant. NPRs are not included in the permanent immigration statistics unless they later transition to permanent status. The NPR population grew rapidly after 2016, peaking at over 3 million people, but is now being reduced through government policy changes.
How does immigration affect Canada's population growth?
Immigration is the dominant driver of Canada's population growth. In recent years, virtually 100 percent of population growth has come from net international migration, as the natural increase from births minus deaths has become very small. A surge in non-permanent residents pushed population growth to a record 3.1 percent in 2023. With recent policy changes reducing the intake of both permanent and temporary residents, population growth has slowed sharply, with estimates showing approximately zero growth in 2025 and flat growth projected for 2026 before a modest recovery.
What is the Express Entry system?
Express Entry is the federal government's online application management system for three key economic immigration programs: the Federal Skilled Worker Program, the Federal Skilled Trades Program, and the Canadian Experience Class. Candidates create a profile and are ranked against others using a points-based system called the Comprehensive Ranking System. The highest-ranked candidates are invited to apply for permanent residence through regular draws. A significant portion of Canada's economic immigrants are admitted through Express Entry.
Which country sends the most immigrants to Canada?
India has been the top source country for immigrants to Canada throughout the 2020s. From 2020 to the first quarter of 2026, 676,615 Indian citizens were admitted as permanent residents, representing 27.5 percent of all immigrants during that period. This continues a trend from the 2010s, when India was also the leading source, accounting for 16.0 percent of admissions. Other major source countries in the 2020s include China at 166,960 persons, the Philippines at 141,825 persons, Nigeria at 102,570 persons, and Afghanistan at 75,705 persons.
Sources and further reading
- Annual immigration statistics of Canada (Wikipedia)
- Canada's national statistical agency (statcan.gc.ca)
- Demographic Implications of the 2026 to 2028 Immigration ... (pbo-dpb.ca)
- Number of newcomers to Canada set to drop significantly (fraserinstitute.org)
- Canada's Immigration Levels Plan 2024 to 2026 (canadavisa.com)
Checked by the Nosy Mag desk. Last updated 2026-10-28.