Demographics of Canada
The demographics of Canada describe the characteristics of the country's population, including its size, growth, ethnic composition, and geographic distribution. As one of the world's most multicultural nations, Canada's demographic profile is shaped significantly by immigration, which is the primary driver of population growth. The country's population surpassed 40 million in 2023 and 41 million in 2024. Statistics Canada's preliminary estimate for July 1, 2026 placed the national population at 41,798,407. Understanding these demographic trends is important for policy planning in areas such as healthcare, housing, and labour markets.
Population Size and Growth
Canada's population is measured through a comprehensive census conducted by Statistics Canada every five years. The 2021 census recorded a total population of 36,991,981 individuals, an increase of about 5.2 percent over the 2016 figure. Population growth has continued steadily, with estimates indicating the total surpassed 40 million in 2023 and 41 million in 2024. By July 1, 2026, Statistics Canada's preliminary estimate placed the national population at 41,798,407. The primary engine for this growth is immigration, which accounts for a larger share of population increase than natural births. In contrast, the country's total fertility rate hit a historic low of 1.25 children per woman in 2024, among the lowest rates globally. This combination of high immigration and low birth rates defines Canada's contemporary demographic trajectory.
The geographic distribution of Canada's population is highly uneven, with the vast majority of people living within 300 kilometres of the southern border with the United States. Ontario is the most populous province, followed by Quebec and British Columbia. Urban centres, particularly the census metropolitan areas of Toronto, Montreal, and Vancouver, are the primary destinations for new immigrants. The population growth rate for Canada was 0.75 percent in 2022. According to the Organisation for Economic Co-operation and Development and World Bank, from 1990 to 2008, Canada's population grew by 5.6 million people, a 20.4 percent increase.
Age Structure and Vital Statistics
Canada's population is aging, a trend reflected in its median age and age dependency ratios. The median age for the total population was 41.8 years as of the 2020 estimate, with women having a higher median age (42.9 years) than men (40.6 years). The age structure shows that 15.99 percent of the population was aged 0 to 14 years, while 18.98 percent was 65 years and older. The potential support ratio, which indicates the number of working-age people (15-64) per senior, was 4.2 in 2015. Provincial variations in median age are significant, ranging from 24.1 years in Nunavut to 44.0 years in Newfoundland and Labrador as of 2011 data.
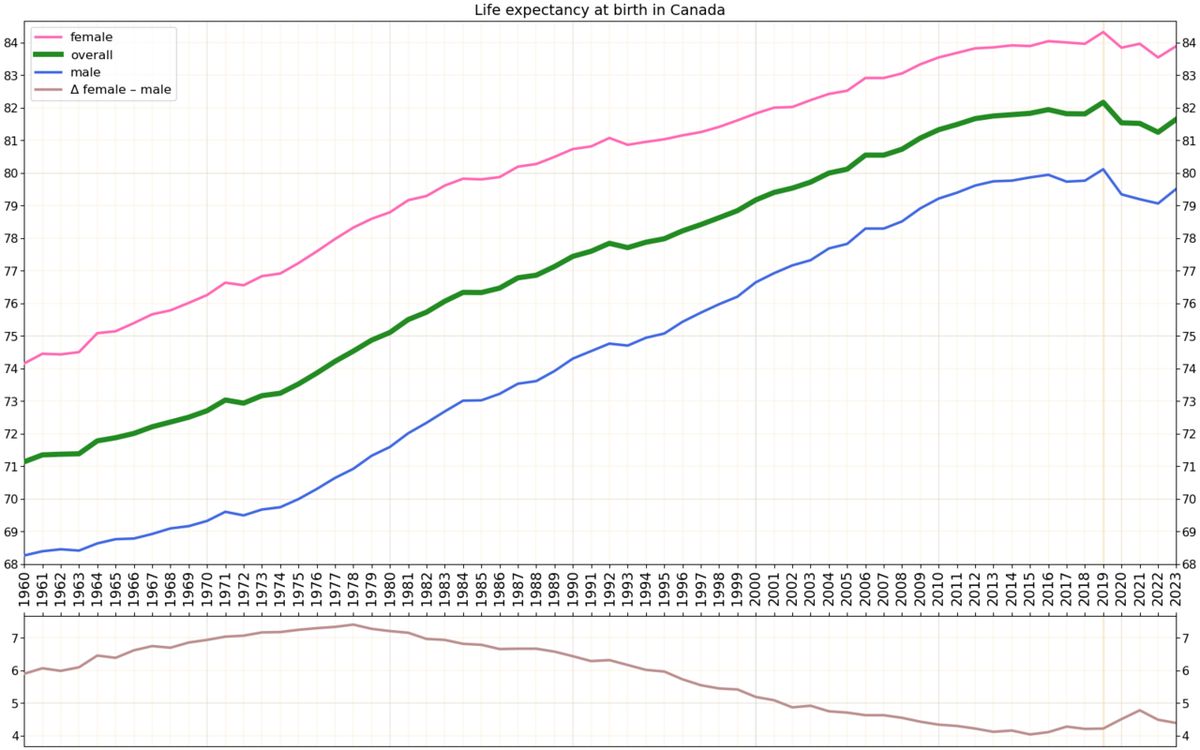
Vital statistics highlight key trends in births and life expectancy. The total birth rate was 10.17 births per 1,000 population in 2022. Canada is a late-childbearing country, with the average age of mothers at first birth being 31.3 years in 2020. A notable trend in 2024 was that 42.3 percent of newborns had a foreign-born mother. Life expectancy in Canada has risen consistently since the country's formation. The infant mortality rate was estimated at 4.5 deaths per 1,000 live births in 2017. The sex ratio at birth was 1.05 males per female in 2022.
| Age Group | Percentage of Population (2020 est.) |
|---|---|
| 0-14 years | 15.99% |
| 15-24 years | 11.14% |
| 25-54 years | 39.81% |
| 55-64 years | 14.08% |
| 65 years and over | 18.98% |
Immigration and Multiculturalism
Canada has one of the highest per-capita immigration rates in the world, a fundamental element of its national identity and economic policy. In the 2021 census, 8.3 million people, or 23 percent of the total population, were immigrants. This represents the eighth-largest immigrant population globally and one of the highest proportions for an industrialized Western country. In the 2024 to 2025 period, a total of 435,421 immigrants were admitted to Canada. The country also accepts a large number of refugees, accounting for over 10 percent of annual global refugee resettlements. Immigration is driven primarily by economic policy, with family reunification being a secondary factor.
New immigrants predominantly settle in major urban areas. Statistics Canada projects that immigrants will represent between 29.1 percent and 34.0 percent of the population by 2041, up from 23.0 percent in 2021. When including first and second-generation persons, the population with at least one foreign-born parent could rise to between 49.8 percent and 54.3 percent. The historical peak for the annual immigration rate was in 1913, when 400,900 new immigrants accounted for 5.3 percent of the population. The highest number of admissions in a single year was 405,330 in 2021. As of 2023, temporary residents made up 6.2 percent of Canada's population, or about 2.5 million people.
- Immigrant population (2021): 8.3 million people.
- Immigration admissions (2024 to 2025): 435,421 people.
- Projected immigrant share by 2041: 29.1% to 34.0%.
- Primary settlement areas: Toronto, Montreal, Vancouver.
- Temporary resident share (2023): 6.2% of population.
Ethnic and Cultural Origins
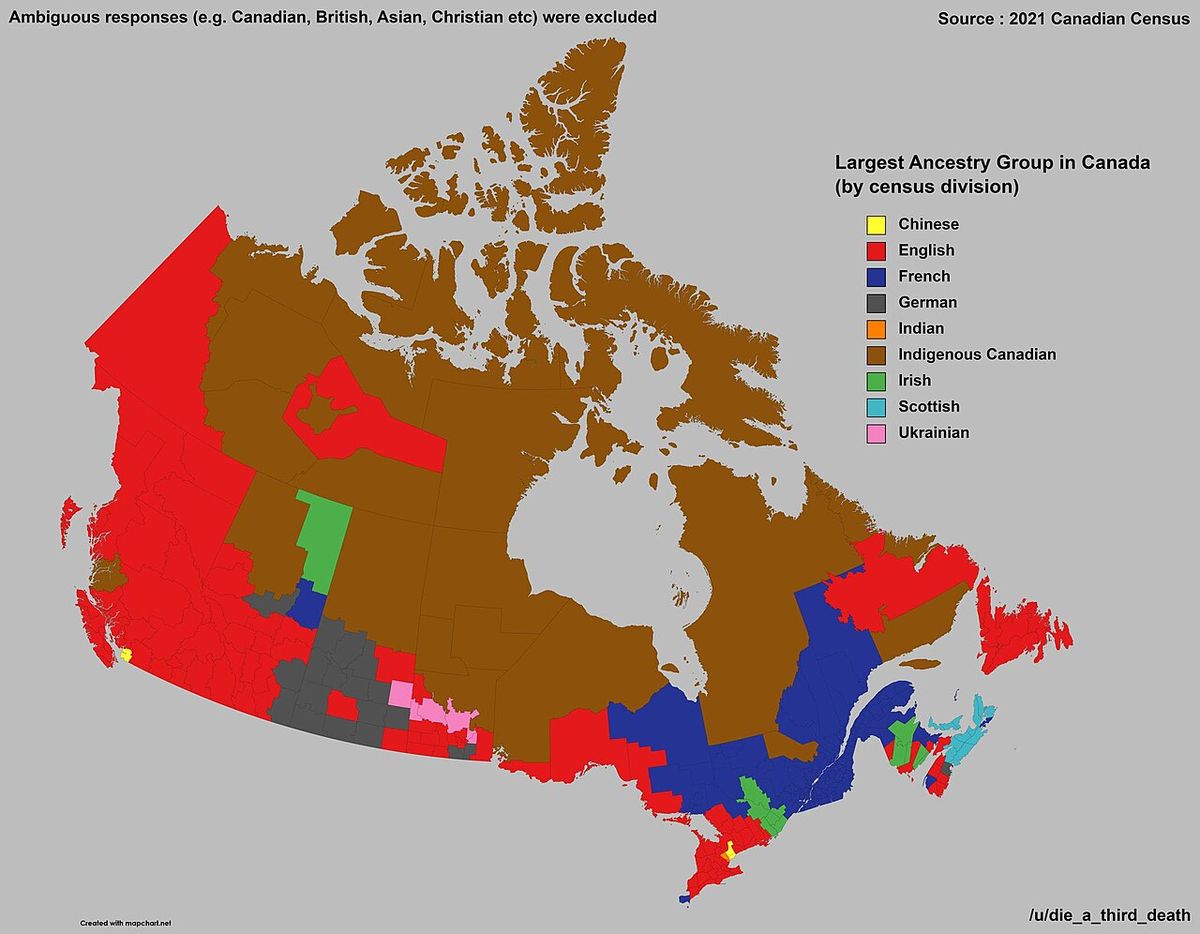
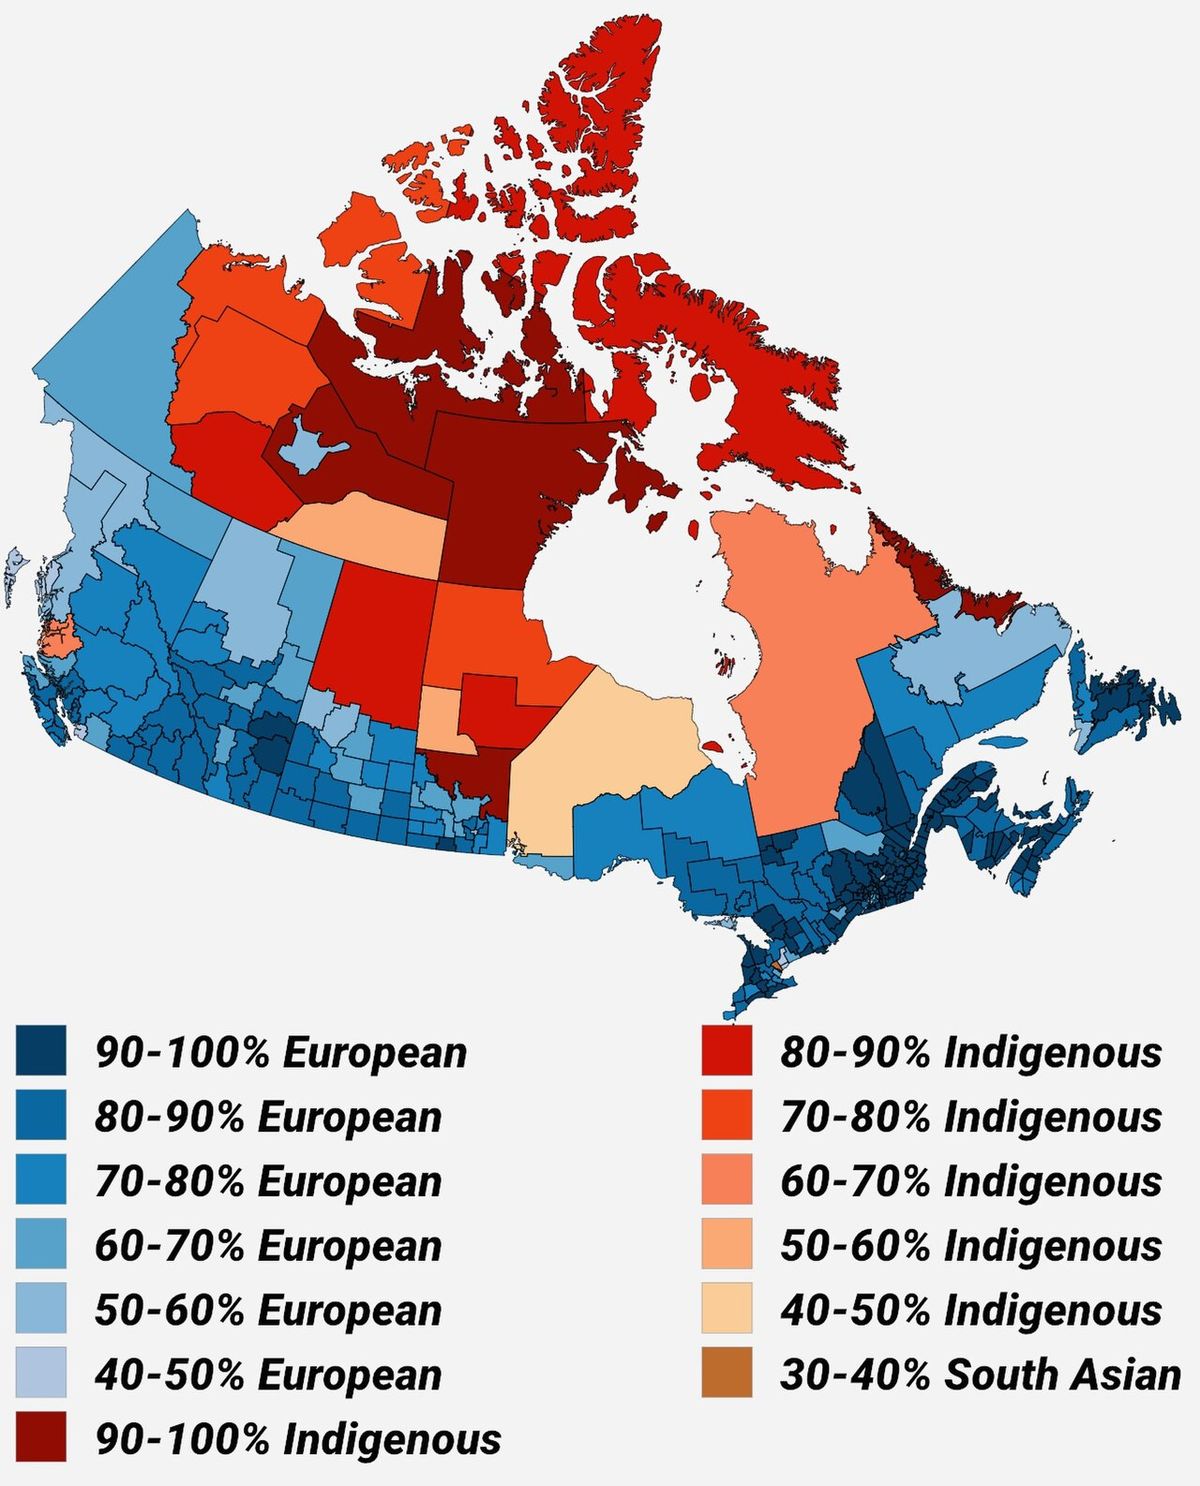
Canadian society is characterized by a rich diversity of ethnic and cultural backgrounds. According to the 2021 census, over 450 different ethnic or cultural origins were self-reported by Canadians. The major panethnic groups were European (52.5%), North American (22.9%), Asian (19.3%), North American Indigenous (6.1%), African (3.8%), Latin, Central and South American (2.5%), Caribbean (2.1%), Oceanian (0.3%), and Other (6%). Notably, 35.5 percent of the population reported multiple ethnic origins. The ten largest specific ethnic origins reported were Canadian (15.6%), English (14.7%), Irish (12.1%), Scottish (12.1%), French (11.0%), German (8.1%), Indian (5.1%), Chinese (4.7%), Italian (4.3%), and Ukrainian (3.5%).
The concept of "Canadian" as an ethnic group was added to census questionnaires in 1996. This response is most common in parts of eastern Canada that were first settled and is often chosen by individuals of European ancestry who may no longer directly identify with specific ancestral origins. In terms of visible minorities, 26.5 percent of the population in 2021 belonged to a group that was non-White and non-Indigenous. The largest visible minority groups were South Asian (2.6 million people, 7.1%), Chinese (1.7 million, 4.7%), and Black (1.5 million, 4.3%). Of the 36.3 million people enumerated in 2021, approximately 25.4 million reported being White, representing 69.8 percent of the population.
Indigenous Peoples
The Indigenous population in Canada represents a vital and growing segment of the country's demographic mosaic. In the 2021 census, Indigenous peoples accounted for 5 percent of the total population, or approximately 1.8 million individuals. This population grew by 9.4 percent from 2016 to 2021, a rate significantly higher than the 5.3 percent growth of the non-Indigenous population. The Indigenous population includes First Nations, Métis, and Inuit peoples. Data on ethnicity and origin in the census is based entirely on self-reporting, meaning individuals define their own identity.
Geographic distribution of Indigenous identity varies greatly across the country. For example, in the 2006 census data, North American Indian was reported as the dominant response in the Northwest Territories (37.0%) and was a significant response in Saskatchewan (12.1%) and Manitoba (10.6%). In Nunavut, 85.4 percent of the population reported Inuit origin. The growth of the Indigenous population is an important factor in demographic analyses and has implications for policy and service delivery in areas such as education, healthcare, and justice. In 2006, the most common ethnic origins in Yukon included North American Indian (21.8%) and Irish (22.0%).
Religious Affiliation
Religious affiliation in Canada has undergone a notable shift in recent decades, moving towards greater secularization and diversity. The 2021 census found that 53.3 percent of Canadians identified as Christian, a decline from 67.3 percent in 2011. The largest Christian denomination was Catholic, at 29.9 percent of the population, followed by Protestant at 11.4 percent. Other Christian groups included Christian Orthodox (1.7%), Jehovah's Witnesses (0.4%), and Latter Day Saints (0.2%). A significant 34.6 percent of the population reported having no religious or secular perspectives, a substantial increase from 23.9 percent in 2011.
Non-Christian religions are growing in Canada, reflecting the nation's increasing multicultural character. Muslims constituted 4.9 percent of the population in 2021, up from 3.2 percent in 2011. Hindus made up 2.3 percent, Sikhs 2.1 percent, Buddhists 1.0 percent, and Jews 0.9 percent. 0.2 percent of Canadians reported adherence to traditional Indigenous spirituality. This evolving religious composition contributes to the social and cultural fabric of communities across the country. The category "other Christian and Christian-related traditions" accounted for 2.1 percent of the population in 2021.
| Religious Affiliation | Percentage of Population (2021) |
|---|---|
| Christian (Total) | 53.3% |
| No religion/Secular | 34.6% |
| Muslim | 4.9% |
| Hindu | 2.3% |
| Sikh | 2.1% |
| Buddhist | 1.0% |
| Jewish | 0.9% |
Future Demographic Projections
Demographic projections indicate that Canada's population will continue to grow and become more diverse in the coming decades. The primary source of growth will remain immigration, as the total fertility rate is expected to stay well below the replacement level of 2.1 children per woman. Statistics Canada projects that by 2041, immigrants could represent between 29.1 percent and 34.0 percent of the population. The population with at least one foreign-born parent is projected to reach between 49.8 percent and 54.3 percent, up from 44.0 percent in 2021. These figures show the increasing role of immigration in shaping the nation's future.
The visible minority population is also projected to expand significantly. By 2041, visible minorities are projected to make up between 38.2 percent and 43.0 percent of Canada's total population, a major increase from 26.5 percent in 2021. Among the working-age population (15 to 64 years), the visible minority share is projected to be even higher, between 42.1 percent and 47.3 percent, compared to 28.5 percent in 2021. These projections highlight the ongoing transformation of Canadian society into one of the world's most multicultural nations, with implications for social cohesion, economic integration, and public policy. The Indigenous population is also expected to continue its growth.
- Projected immigrant share by 2041: 29.1% to 34.0%.
- Projected visible minority share by 2041: 38.2% to 43.0%.
- Projected working-age visible minority share by 2041: 42.1% to 47.3%.
- Projected population with foreign-born parent by 2041: 49.8% to 54.3%.
- Continued low fertility rate expected.
Questions about Demographics of Canada
What was Canada's population in the 2021 census?
The 2021 Canadian census enumerated a total population of 36,991,981 individuals. This figure represented an increase of approximately 5.2 percent over the 2016 census count. The census is conducted by Statistics Canada every five years and serves as the official count of the country's population. Population estimates have continued to grow since then, surpassing 40 million by 2023 and 41 million by 2024.
What is Canada's current fertility rate?
Canada's total fertility rate hit a record low of 1.25 children per woman in 2024, which is among the lowest rates in the world. This rate was tied again in 2025, marking the third consecutive year of ultra-low fertility below 1.30. The fertility rate has been below the replacement level of 2.1 since 1971 and has not rebounded. In 2022, Canada also experienced its lowest absolute number of births in 17 years.
How important is immigration to Canada's population growth?
Immigration is the main driver of population growth in Canada. The country has one of the highest per-capita immigration rates globally. In the 2024 to 2025 period, 435,421 immigrants were admitted. As of the 2021 census, 8.3 million people, or 23 percent of the population, were immigrants. As of 2023, temporary residents also made up 6.2 percent of the population, or about 2.5 million people.
What are the largest ethnic groups in Canada?
According to the 2021 Canadian census, the ten largest self-reported specific ethnic or cultural origins were Canadian at 15.6 percent of the population, English at 14.7 percent, Irish at 12.1 percent, Scottish at 12.1 percent, and French at 11.0 percent. Other major groups were German at 8.1 percent, Indian at 5.1 percent, Chinese at 4.7 percent, Italian at 4.3 percent, and Ukrainian at 3.5 percent. Over 450 different ethnic or cultural origins were self-reported by Canadians. Statistics Canada reports that 35.5 percent of the population reported multiple ethnic origins.
How is the religious composition of Canada changing?
Canada's religious composition is becoming more secular and diverse. In 2021, 53.3 percent of Canadians identified as Christian, down from 67.3 percent in 2011. Conversely, 34.6 percent reported no religious affiliation, a significant increase. Non-Christian religions are growing, with Muslims at 4.9 percent, Hindus at 2.3 percent, and Sikhs at 2.1 percent of the population in 2021. The largest Christian denomination was Catholic at 29.9 percent.
What percentage of Canadians belong to a visible minority?
In the 2021 Canadian census, 26.5 percent of the population belonged to a non White and non Indigenous visible minority. This represents one out of every four Canadians. The largest visible minority groups were South Asian at 7.1 percent of the population, Chinese at 4.7 percent, and Black at 4.3 percent. Of the 36.3 million people enumerated in 2021, approximately 25.4 million reported being White, representing 69.8 percent of the population. Statistics Canada projects that visible minorities will make up between 38.2 percent and 43.0 percent of the total Canadian population by 2041.
Sources: Wikipedia and current public reporting, checked by the Nosy Mag desk. Last updated 2026-10-25.